git clone git@github.com:sekilab/RoadDamageDetector.git

wget https://s3-ap-northeast-1.amazonaws.com/mycityreport/RoadDamageDataset.tar.gz
wget https://s3-ap-northeast-1.amazonaws.com/mycityreport/trainedModels.tar.gz
tar -zxf ./RoadDamageDataset.tar.gz
tar -zxf ./trainedModels.tar.gz

cd RoadDamageDataset

#删除掉 "Adachi", "Chiba", "Ichihara", "Muroran", "Nagakute", "Numazu", "Sumida"  子文件夹  /Annotations/ 中  ._ 开头的文件。否则执行会报错。
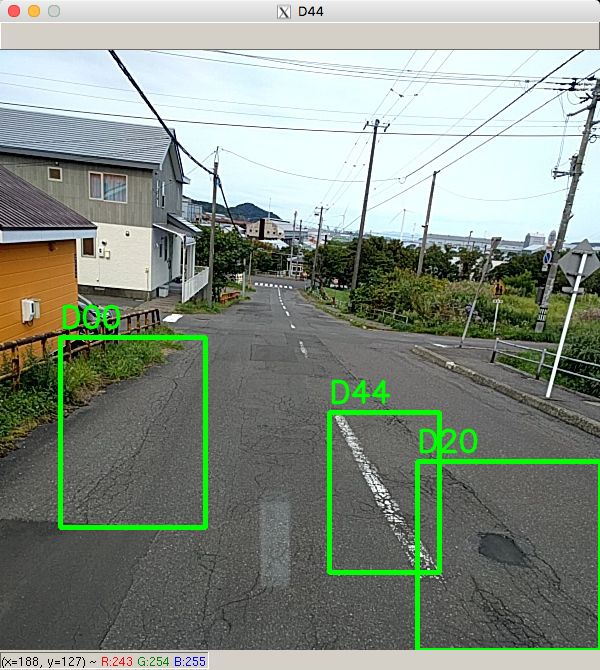
改写了用cv.imshow 展示的 py代码。
from xml.etree import ElementTree
from xml.dom import minidom
import collections

import os

import matplotlib.pyplot as plt
import matplotlib as matplot
import seaborn as sns
#%matplotlib inline

base_path = os.getcwd() + '/RoadDamageDataset/'
print(base_path)
damageTypes=["D00", "D01", "D10", "D11", "D20", "D40", "D43", "D44"]

# govs corresponds to municipality name.
govs = ["Adachi", "Chiba", "Ichihara", "Muroran", "Nagakute", "Numazu", "Sumida"]

# the number of total images and total labels.
cls_names = []
total_images = 0
for gov in govs:

    file_list = os.listdir(base_path + gov + '/Annotations/')

    for file in file_list:

        total_images = total_images + 1
        if file =='.DS_Store':
            pass
        else:
            infile_xml = open(base_path + gov + '/Annotations/' +file)
            #print(infile_xml)
            tree = ElementTree.parse(infile_xml)
            root = tree.getroot()
            for obj in root.iter('object'):
                cls_name = obj.find('name').text
                cls_names.append(cls_name)
print("total")
print("# of images:" + str(total_images))
print("# of labels:" + str(len(cls_names)))

# the number of each class labels.
import collections
count_dict = collections.Counter(cls_names)
cls_count = []
for damageType in damageTypes:
    print(str(damageType) + ' : ' + str(count_dict[damageType]))
    cls_count.append(count_dict[damageType])

sns.set_palette("winter", 8)
sns.barplot(damageTypes, cls_count)

# the number of each class labels for each municipality
for gov in govs:
    cls_names = []
    total_images = 0
    file_list = os.listdir(base_path + gov + '/Annotations/')

    for file in file_list:

        total_images = total_images + 1
        if file =='.DS_Store':
            pass
        else:
            infile_xml = open(base_path + gov + '/Annotations/' +file)
            tree = ElementTree.parse(infile_xml)
            root = tree.getroot()
            for obj in root.iter('object'):
                cls_name = obj.find('name').text
                cls_names.append(cls_name)
    print(gov)
    print("# of images:" + str(total_images))
    print("# of labels:" + str(len(cls_names)))

    count_dict = collections.Counter(cls_names)
    cls_count = []
    for damageType in damageTypes:
        print(str(damageType) + ' : ' + str(count_dict[damageType]))
        cls_count.append(count_dict[damageType])

    print('**************************************************')


import cv2
import random

def draw_images(image_file):
    gov = image_file.split('_')[0]
    img = cv2.imread(base_path + gov + '/JPEGImages/' + image_file.split('.')[0] + '.jpg')
    print(base_path + gov + '/JPEGImages/' + image_file.split('.')[0] + '.jpg')
    infile_xml = open(base_path + gov + '/Annotations/' +image_file)
    tree = ElementTree.parse(infile_xml)
    root = tree.getroot()

    for obj in root.iter('object'):
        cls_name = obj.find('name').text
        xmlbox = obj.find('bndbox')
        xmin = int(xmlbox.find('xmin').text)
        xmax = int(xmlbox.find('xmax').text)
        ymin = int(xmlbox.find('ymin').text)
        ymax = int(xmlbox.find('ymax').text)

        font = cv2.FONT_HERSHEY_SIMPLEX

        # put text
        cv2.putText(img,cls_name,(xmin,ymin-10),font,1,(0,255,0),2,cv2.LINE_AA)

        # draw bounding box
        cv2.rectangle(img, (xmin, ymin), (xmax, ymax), (0,255,0),3)
    return img

for damageType in damageTypes:
    tmp = []
    for gov in govs:
        file = open(base_path + gov + '/ImageSets/Main/%s_trainval.txt' %damageType, 'r')

        for line in file:
            line = line.rstrip('\n').split('/')[-1]
            #print(line)
            if line.split(' ')[2] == '1':
                tmp.append(line.split(' ')[0]+'.xml')

    #print(tmp)
    random.shuffle(tmp)
    fig = plt.figure(figsize=(6,6))
    for number, image in enumerate(tmp[0:1]):
      #if(number > 0):
        print('number & image :' + str(number) + image)
        print('The image including ' + damageType)
        img = draw_images(image)
        cv2.imshow(damageType,img)


while(1):
    if cv2.waitKey(1) & 0xFF == ord('q'):
        break
	#plt.subplot(1,1,number)
        #plt.axis('off')
        #plt.title('The image including ' + damageType)
        #plt.imshow(cv2.cvtColor(img, cv2.COLOR_BGR2RGB))

您好,请问上面提示的说“._”需要删掉,我打开它哪些标注文件发现都有点像乱码,但是测试这些数据的时候都没有发现问题,等开始使用模型进行检测的时候就发现那些标注文件需要删除._的了。所以那些文件打开像乱码是没有关系的吗?谢谢